Player of the Year
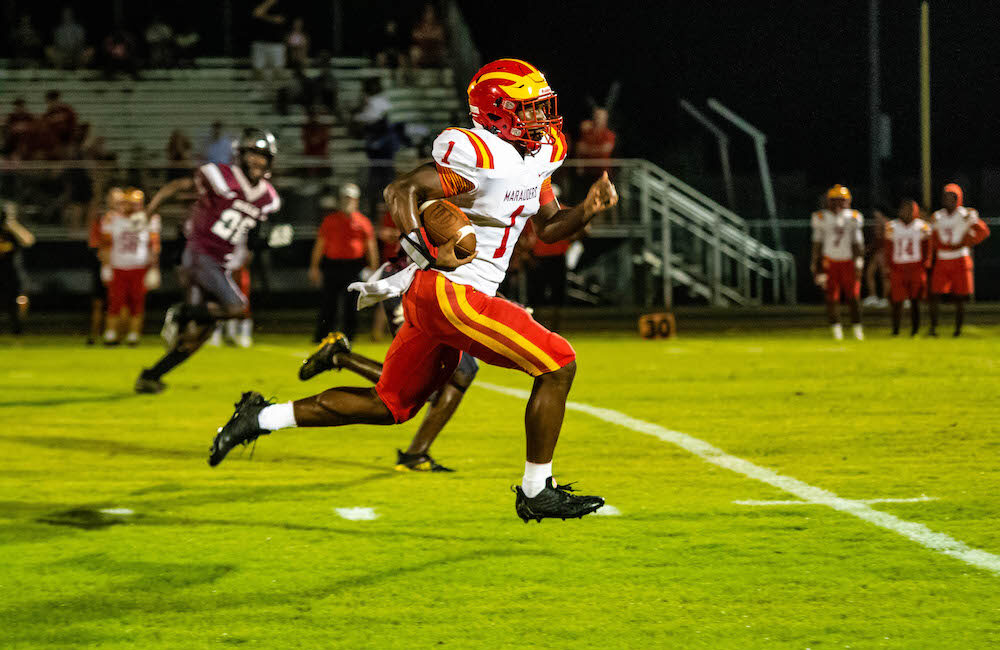
Jershaun Newton, Clearwater Central Catholic 2025
The sophomore standout threw for 2,219 yards and 23 touchdowns this season while also rushing for 1,355 yards and 15 touchdowns. Jershaun truly had a remarkable season that saw him lead the Marauders to the 1M state championship game against Chaminade-Madonna. He finished with more than 300 total yards in four games this season. He finished games with over 100 rushing yards and 100 passing yards five times also. Overall, Newton accounted for 38 of CCC’s 55 offensive touchdowns. His overall body of work against a difficult schedule proves that he is more than deserving of the title of the 2022 All BCP Player of the Year.
Offensive Player of the Year
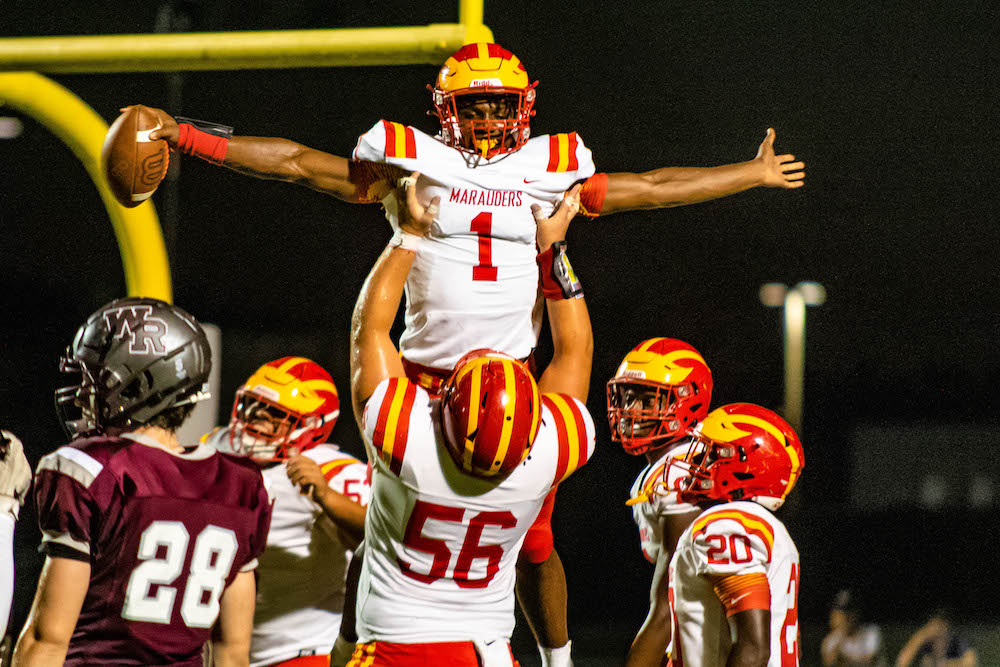
Anthony Colandrea, Lakewood 2023
It’s hard to argue with consistency. Hit rewind and look at Anthony’s 2021 stats. He completed 216 passes (62.6%) for 3,252 yards and 27 TDs with just 10 interceptions. But All BCP’s focus is “What have you done for me lately?” So you jump to his 2022 stats and see that he completed 224 passes (64.2%) for 3,137 yards and 28 passing TDs with just 8 interceptions. Anthony also just had his best season with his legs as he rushed for 657 yards and 6 touchdowns for an average of 50.5 rushing yards per game.

Defensive Player of the Year
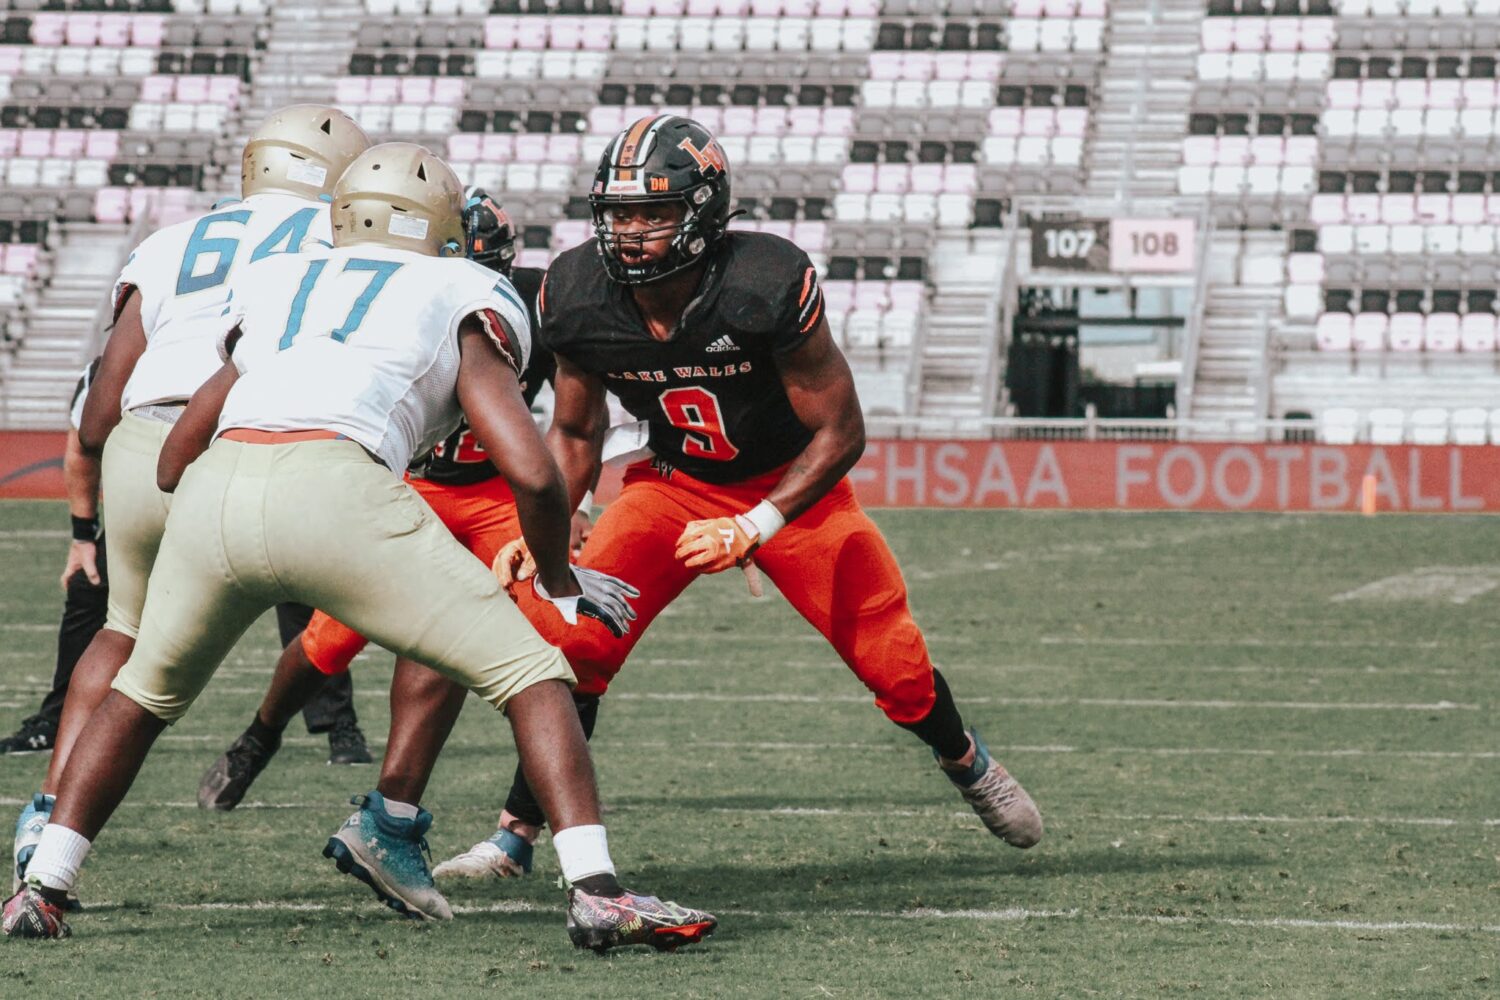
Terrell James, Lake Wales 2023
29 sacks would be a great career total for most high school players. 108 total tackles is two games worth for most defenses. 58 tackles for loss is a disaster for every offense he played against. The numbers Terrell James produced on his way to leading his team to an undefeated 3S state championship are crazy: 79 solo tackles, 108 total tackles, 58 tackles for loss, 29 sacks, 2 caused fumbles. The 6’4” 225 pound senior posted 13 double-digit TFL games and had at least 2 sacks in every game but the Lake Region game in mid-September.
Special Teams Player of the Year
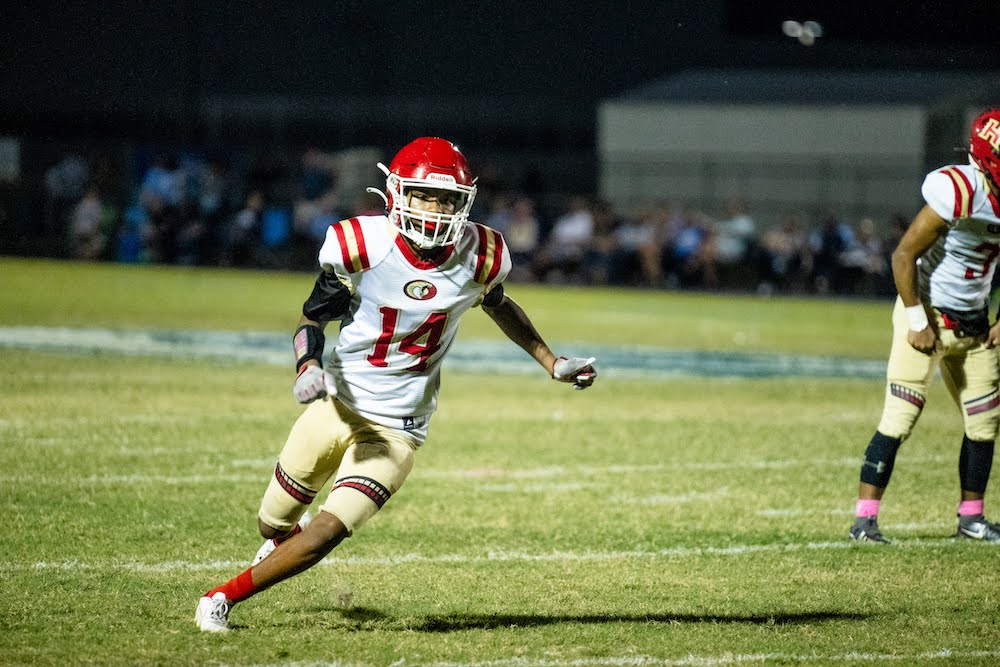
James Conley, Hudson 2024
Conley averaged 37.4 yards per kickoff return and 28.8 yards per punt return. Both numbers are extremely impressive. He single-handedly kept the offense in good field position proving to be a true weapon on the third side of the ball. He returned 4 kickoffs and 2 punts for touchdowns.
Coach of the Year
Tavaris Johnson, Lake Wales
15-0 and a state title. Let’s start there. His offense produced 598 points, that’s an astounding 40 points per game. Even more impressive, his defense allowed less than a touchdown a game. In 12 of the 15 games this season the Highlanders did not allow a double-digit score to the opponent while the offense produced 40 or more points in 7 games. The Highlanders were dominant on all three sides of the ball. Fast, physical and disciplined. Congrats to Coach Johnson and the Highlanders.
All BCP Is a Regional Team covering Citrus, Charlotte, Desoto, Hardee, Hernando, Highlands, Hillsborough, Pasco, Pinellas, Polk, Manatee, Orange, Osceola, Sarasota, Sumter – Coving 15 counties. We reserve the right to make additions at any time.
Key:
OW – Offensive Weapon
UTL – Utility
| FIRST TEAM OFFENSE | |||||||||
| Pos | First Name | Last Name | School | Class | Total Passing Yards | Passing Yards Per Game | Completion Percentage | Passing TD-INT | QBR |
| PSQB | Jayce | Nixon | Gaither | 2025 | 3,269 | 272 | 0.636 | 36-11 | 116 |
| Total Yards | Passing Yards | Passing TDs | Rushing Yards | Rushing TDs | |||||
| DTQB | Joseph | Tarver | Winter Haven | 2023 | 2,722 | 1,598 | 12 | 1,124 | 9 |
| Total Rushing Yards | Yards Per Rush | Rushing Yards Per Game | Total Rushing Attempts | Rushing TDs | |||||
| RB | Tayshaun | Balmir | Pasco | 2023 | 1,899 | 11.4 | 173 | 167 | 22 |
| RB | Sean | Cuono | Calvary Chr. | 2025 | 1,786 | 8 | 137 | 222 | 20 |
| RB | Luke | Yoder | East Lake | 2023 | 1,673 | 9.78 | 129 | 171 | 25 |
| Total Receiving Yards | Receiving Yards Per Game | Total Receptions | Receiving TDs | Total TDs | |||||
| WR | Asaad | Waseem | Ocoee | 2023 | 1,353 | 97 | 73 | 16 | 16 |
| WR | Isaiah | Hudson | Sickles | 2024 | 1,117 | 112 | 70 | 10 | 8 |
| WR | Aviyon | Mack-Smith | Lakewood | 2023 | 1,078 | 83 | 65 | 8 | 9 |
| TE | Brock | Couch | East Lake | 2023 | 438 | 37 | 30 | 9 | 12 |
| OL | Matthew | Peavley | Venice | 2024 | |||||
| OL | Wesley | Shaw | Jesuit | 2023 | |||||
| OL | Eddie | Pierre-Louis | Tampa Catholic | 2024 | |||||
| OL | Gernorris | Wilson | Lakeland | 2023 | |||||
| OL | Melvin | Robinson Jr. | Lakeland | 2023 | |||||
| TOTAL ALL-PURPOSE YARDS | ALL-PURPOSE YARDS PER GAME | TOTAL TOUCHDOWNS | |||||||
| OW | Dallas | Golden | Berkeley Prep | 2025 | 1,744 | 145 | 20 | ||
| OW | Taevion | Swint | Osceola (Kissimmee) | 2025 | 2,193 | 157 | 25 | ||
| Total Return (Punt & Kickoff) Yards | Kickoff Return Yards | Punt Return Yards | Total Return (Punt & Kickoff) Touchdowns | ||||||
| RET | Allan | Lewis | Robinson | 2024 | 798 | 604 | 194 | 4 | |
| PAT Made Percentage | Total Field Goals Made | Total Field Goals Attempts | Field Goal Made Percentage | Field Goal Long Made | |||||
| PK | Brandon | Gonzales | Palmetto | 2024 | 0.1 | 10 | 12 | 0.83 | 41 |
| FIRST TEAM DEFENSE | |||||||||
| Pos | First Name | Last Name | School | Class | Total Sacks | Total Tackles For Loss | Total Tackles | Forced Fumbles | |
| DL | Booker | Pickett Jr. | Wharton | 2024 | 30 | 16 | 56 | 4 | |
| DL | Keon | Keeley | Berkeley Prep | 2023 | 17 | 23.5 | 40 | 5 | |
| DL | Larry | Jones | Lakeland | 2023 | 16 | 25 | 66 | 0 | |
| DL | Sean | Sevillano Jr. | Clearwater Acd. Int. | 2024 | 19 | 21 | 75 | 3 | |
| DL | Sincere | Edwards | Wekiva | 2024 | 16 | 27 | 78 | 0 | |
| DL | Antonio | Henley | Gaither | 2025 | 16 | 32 | 70 | 4 | |
| Total Sacks | Total Tackles For Loss | Total Solo Tackles | Total Tackles | Forced Fumbles | |||||
| LB | Madden | Buratczuk | Springstead | 2023 | 21 | 35 | 53 | 87 | 2 |
| LB | Sean | Major | Lake Wales | 2023 | 12 | 62 | 150 | 187 | 4 |
| LB | Johnquae | Richardson | Lake Wales | 2023 | 11 | 50 | 155 | 186 | 4 |
| LB | Rashad | Watson | Apopka | 2023 | 3 | 9 | 94 | 141 | 2 |
| LB | Jawarren | Corbin | South Sumter | 2023 | 6 | 20 | 22 | 78 | 1 |
| LB | Eli | Seed | Venice | 2024 | 0 | 3 | 82 | 127 | 2 |
| LB | Troy | Bowles | Jesuit | 2023 | 0 | 5 | 63 | 90 | 0 |
| Total Solo Tackles | Total Tackles | Passes Defended | Interceptions | ||||||
| DB | Jaremiah | Anglin Jr. | Lake Wales | 2023 | 46 | 62 | 21 | 8 | |
| DB | Philipp | Davis | Lake Wales | 2023 | 33 | 46 | 13 | 8 | |
| DB | Elliot | Washington | Venice | 2023 | 40 | 56 | 4 | 4 | |
| DB | Cormani | McClain | Lakeland | 2023 | Production attributed to teams not throwing in his direction. Eliminated the best receiver or half the field. | ||||
| Pos | Total Tackles For Loss | Total Tackles | Interceptions | Total Yards | Total Touchdowns | ||||
| UTL | Caleb | Coburn | East Lake | 2023 | 11 | 68 | 0 | 2,695 | 19 |
| UTL | Carlos | Mitchell | Lake Wales | 2024 | 9 | 81 | 7 | 837 (1,643 AP Yards) | 19 |
| Pos | Total Punt Attempts | Total Punt Yards | Avg. Yards Per Punt | Total Punts Inside the 20 | |||||
| P | Max’Ceon | Cobb | Jones | 2023 | 38 | 1784 | 47 | 13 | |
| SECOND TEAM OFFENSE | |||||||||
| Pos | First Name | Last Name | School | Class | Total Passing Yards | Passing Yards Per Game | Completion Percentage | Passing TD-INT | QBR |
| PSQB | Trent | Grotjan | Lake Wales | 2023 | 2,358 | 168 | 0.6 | 28-9 | 121 |
| Total Yards | Passing Yards | Passing TDs | Rushing Yards | Rushing TDs | |||||
| DTQB | Chris | Ferrini | Mitchell | 2023 | 2,273 | 1,261 | 13 | 1,012 | 15 |
| Total Rushing Yards | Rushing Yards Per Game | Yards Per Rush | Total Rushing Attempts | Rushing TDs | |||||
| RB | Taevion | Swint | Osceola | 2025 | 1,666 | 119 | 7.4 | 224 | 20 |
| RB | Cedric | Baxter | Edgewater | 2023 | 1,375 | 138 | 7.9 | 174 | 13 |
| RB | Joquez | Smith | Jesuit | 2023 | 1,410 | 101 | 6 | 235 | 19 |
| Total Receiving Yards | Receiving Yards Per Game | Total Receptions | Receiving TDs | Total TDs | |||||
| WR | TJ | Moore | Tampa Catholic | 2024 | 1,021 | 93 | 42 | 13 | 18 |
| WR | Josiah | Booker | Booker | 2024 | 957 | 87 | 58 | 9 | 9 |
| WR | Demitrius | Carter Jr. | Steinbrenner | 2023 | 923 | 84 | 48 | 11 | 11 |
| TE | Koby | Keenan | Manatee | 2023 | 346 | 43 | 28 | 3 | 3 |
| OL | Xzavier | McKinney | Manatee | 2023 | |||||
| OL | Cayden | Fluker | Jesuit | 2023 | |||||
| OL | Isaiah | Johnson | Lakewood | 2023 | |||||
| OL | Trenton | Hayes | Nature Coast | 2024 | |||||
| OL | James | Jenkins | Carrollwood Day | 2023 | |||||
| TOTAL ALL-PURPOSE YARDS | ALL-PURPOSE YARDS PER GAME | TOTAL TOUCHDOWNS | |||||||
| OW | J.C. | Roque | Newsome | 2023 | 1,735 | 174 | 23 | ||
| OW | Waltez | Clark | Plant | 2025 | 1,375 | 125 | 22 | ||
| Total Return (Punt & Kickoff) Yards | Kickoff Return Yards | Punt Return Yards | Total Return (Punt & Kickoff) Touchdowns | ||||||
| RET | Jaquez | Kindell | Plant | 2023 | 784 | 774 | 10 | 5 | |
| PAT Made Percentage | Total Field Goals Made | Total Field Goals Attempts | Field Goal Made Percentage | Field Goal Long Made | |||||
| PK | Jack | Ferreri | Jesuit | 2023 | 0.1 | 9 | 11 | 0.8 | 50 |
| SECOND TEAM DEFENSE | |||||||||
| Pos | First Name | Last Name | School | Class | Total Sacks | Total Tackles For Loss | Total Tackles | Forced Fumbles | |
| DL | Calvin | Smith | Ocoee | 2023 | 19.5 | 38 | 107 | 4 | |
| DL | Damon | Wilson | Venice | 2023 | 10 | 10 | 94 | 2 | |
| DL | Solomon | Williams | Carrollwood Day | 2024 | 15.5 | 32 | 61 | 1 | |
| DL | Antonio | Hunt | Zephyrhills Chr. | 2023 | 15 | 12.5 | 60 | 0 | |
| DL | Devin | Williams | Hernando | 2023 | 15 | 21 | 104 | 0 | |
| DL | Peter | Pesansky | Jesuit | 2024 | 15 | 10 | 91 | 0 | |
| Total Sacks | Total Tackles For Loss | Total Solo Tackles | Total Tackles | Forced Fumbles | |||||
| LB | Josiah | Taylor | Sebring | 2024 | 1.5 | 7 | 85 | 124 | 1 |
| LB | Carver | Wineinger | Lakeland Chr. | 2023 | 6 | 7 | 25 | 123 | 2 |
| LB | Adarius | Hayes | Largo | 2024 | 0 | 14 | 52 | 121 | 6 |
| LB | George | Leibold | Cardinal Mooney | 2024 | 2 | 8 | 84 | 117 | 1 |
| LB | Devin | Andrews | Plant | 2023 | 5 | 19 | 66 | 117 | 0 |
| LB | Zayvion | Mccluster | Largo | 2023 | 1 | 20 | 46 | 117 | 2 |
| Total Solo Tackles | Total Tackles | Passes Defended | Interceptions | ||||||
| DB | Marcus | McCluster | Largo | 2024 | 19 | 38 | 5 | 5 | |
| DB | Donovan | Lanier | West Orange | 2025 | 12 | 24 | 13 | 6 | |
| DB | Dijon | Johnson | Wharton | 2023 | Production attributed to teams not throwing in his direction. Eliminated the best reciver or half the field. | 10 | 5 | 1 | |
| DB | Acetron | Ealey | Ocoee | 2024 | 41 | 56 | 8 | 6 | |
| Total Tackles For Loss | Total Tackles | INT | Total All-Purpose Yards | Total Touchdowns | |||||
| UTL | Lewis | Carter | Tampa Catholic | 2023 | 0 | 108 | 2 | 1,049 | 15 |
| UTL | Xavier | Marlow | Lake Wales | 2023 | 1 | 47 | 6 | 1,114 | 17 |
| Total Punt Attempts | Total Punt Yards | Avg. Yards Per Punt | Total Punts Inside the 20 | ||||||
| P | Jayden | Davis | Sunlake | 2024 | 41 | 1,696 | 41 | 8 | |
| THIRD TEAM OFFENSE | |||||||||
| Pos | First Name | Last Name | School | Class | Total Passing Yards | Passing Yards Per Game | Completion Percentage | Passing TD-INT | QBR |
| PSQB | Jacob | Drackett | Calvary Chr. | 2024 | 2,606 | 200.5 | 0.68 | 33-9 | 121 |
| Total Yards | Passing Yards | Passing TDs | Rushing Yards | Rushing TDs | |||||
| DTQB | Greg | Smith | Sumner | 2024 | 2,210 | 1,423 | 14 | 787 | 11 |
| Total Rushing Yards | Rushing Yards Per Game | Yards Per Rush | Total Rushing Attempts | Rushing TDs | |||||
| RB | Rod | Gainey Jr. | Tampa Bay Tech | 2024 | 1,518 | 127 | 9.6 | 158 | 14 |
| RB | Amir | Wilson | Lecanto | 2023 | 1,606 | 134 | 7.4 | 218 | 12 |
| RB | Nashaun | Pryor | Jefferson | 2023 | 1,601 | 160 | 7.9 | 203 | 14 |
| Total Receiving Yards | Receiving Yards Per Game | Total Receptions | Receiving TDs | Total TDs | |||||
| WR | Derrick | Rogers | Jones | 2023 | 920 | 71 | 49 | 8 | 8 |
| WR | Nate | Johnson | Clearwater Cen. Cath. | 2023 | 917 | 71 | 52 | 8 | 9 |
| WR | Ladainian | Ferrell | Gaither | 2024 | 903 | 75 | 66 | 6 | 7 |
| TE | Luke | Petitta | Riverview (Sarasota) | 2023 | 235 | 29 | 13 | 3 | 3 |
| OL | Keion | Brown-Smith | Palmeetto | 2023 | |||||
| OL | Jaylon | Key Johnson | East Bay | 2023 | |||||
| OL | Joseph | Ionata | Calvary Chr. | 2024 | |||||
| OL | Chris | Luna | Tampa Catholic | 2023 | |||||
| OL | Jaden | Ledbetter | Lakewood | 2023 | |||||
| TOTAL ALL-PURPOSE YARDS | ALL-PURPOSE YARDS PER GAME | TOTAL TOUCHDOWNS | |||||||
| OW | Kevin | Everhart | Lakewood Ranch | 2023 | 1,468 | 147 | 25 | ||
| OW | Terrence | Jackson | Countryside | 2023 | 1,754 | 175 | 20 | ||
| Total Return (Punt & Kickoff) Yards | Kickoff Return Yards | Punt Return Yards | Total Return (Punt & Kickoff) Touchdowns | ||||||
| RET | Geremyah | Porter | Tarpon Spring | 2024 | 641 | 567 | 74 | 1 | |
| PAT Made Percentage | Total Field Goals Made | Total Field Goals Attempts | Field Goal Made Percentage | Field Goal Long Made | |||||
| PK | Alex | Tuyo | Harmony | 2023 | 0.9 | 10 | 14 | 0.7 | 49 |
| THIRD TEAM DEFENSE | |||||||||
| Total Sacks | Total Tackles For Loss | Total Tackles | Forced Fumbles | ||||||
| DL | Austin | Stief | Cypress Creek | 2023 | 12 | 26 | 122 | 2 | |
| DL | Anthony | Pratt | Pasco | 2023 | 15 | 26.5 | 87 | 3 | |
| DL | Tavoris | Jones | Lake Wales | 2023 | 15 | 37 | 84 | 1 | |
| DL | Donta | Jenkins | Plant City | 2025 | 13 | 16 | 53 | 0 | |
| DL | Isaiah | Nixon | Lakewood | 2023 | 13 | 20 | 56 | 5 | |
| DL | Taveon | Wheeler | Lakewood | 2023 | 13 | 32 | 65 | 2 | |
| Total Sacks | Total Tackles For Loss | Total Solo Tackles | Total Tackles | Forced Fumbles | |||||
| LB | Dominic | Wood | Venice | 2023 | 0 | 2 | 73 | 115 | 0 |
| LB | Dylan | Simpson | Clearwater Acd. Int. | 2023 | 6 | 21 | 104 | 114 | 0 |
| LB | Martell | Thomas | Victory Chr. | 2024 | 3.5 | 11.5 | 29 | 112 | 0 |
| LB | Noah | Nixon | West Orange | 2023 | 6 | 13 | 62 | 112 | 0 |
| LB | Malakhi | Boone | South Sumter | 2025 | 8 | 21 | 15 | 85 | 1 |
| LB | Brady | Nowlan | Nature Coast | 2023 | 4 | 16 | 52 | 108 | 1 |
| Total Solo Tackles | Total Tackles | Passes Defended | Interceptions | ||||||
| DB | Tristan | Mitchum | Newsome | 2024 | 20 | 52 | 2 | 6 | |
| DB | Armoni | Rue | Victory Chr. Acd. | 2023 | 28 | 60 | 0 | 6 | |
| DB | Kaleb | Jones | East Bay | 2024 | 15 | 23 | 5 | 5 | |
| DB | Drew | Woodaz | Jesuit | 2024 | 47 | 77 | 9 | 1 | |
| Total Tackles For Loss | Total Tackles | INT | Total All-Purpose Yards | Total Touchdowns | |||||
| UTL | Guiseann | Mirtil | Winter Haven | 2024 | 10 | 44 | 1 | 481 | 8 |
| UTL | Eugene | Wilson III | Gaither | 2023 | 0 | 6 | 5 | 940 | 13 |
| Pos | Total Punt Attempts | Total Punt Yards | Avg. Yards Per Punt | Total Punts Inside the 20 | |||||
| P | Nathaniel | Sosa-Jones | Lakewood | 2023 | 31 | 1,376 | 44 | 1 |
